Understand what’s happening near you
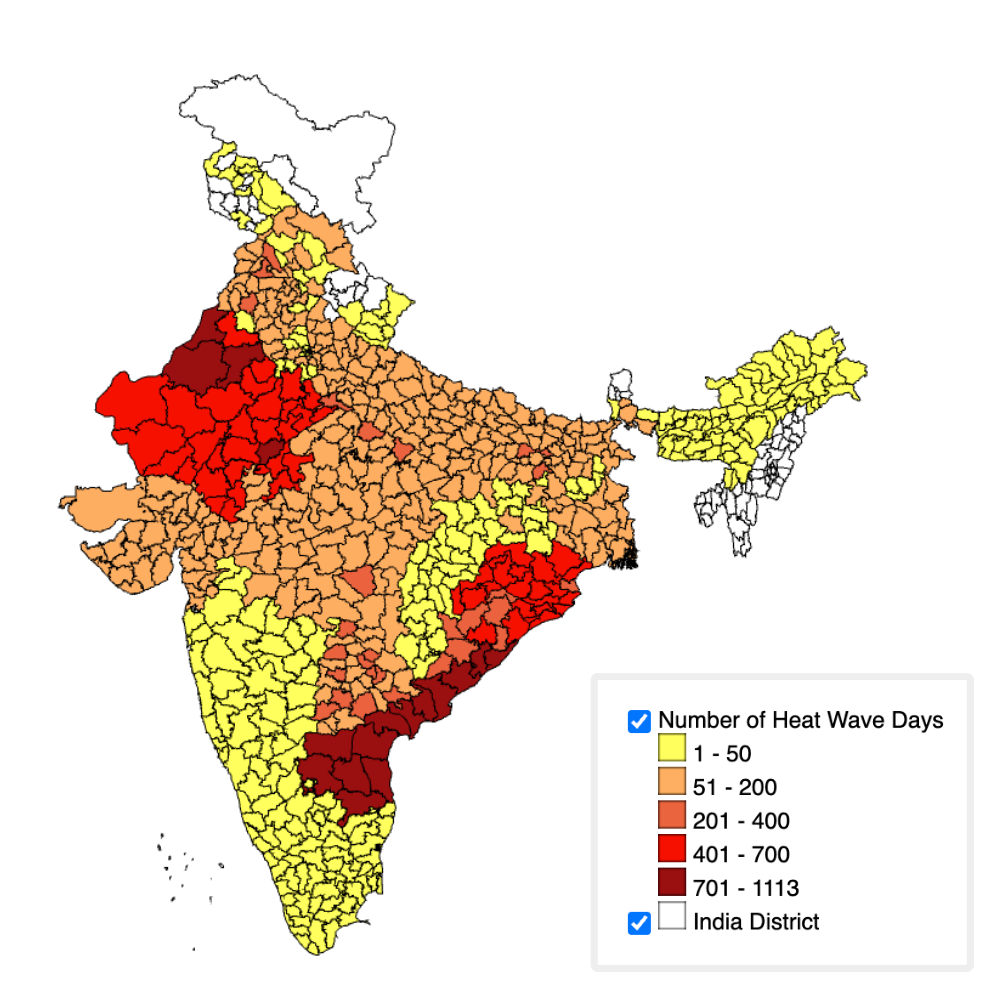
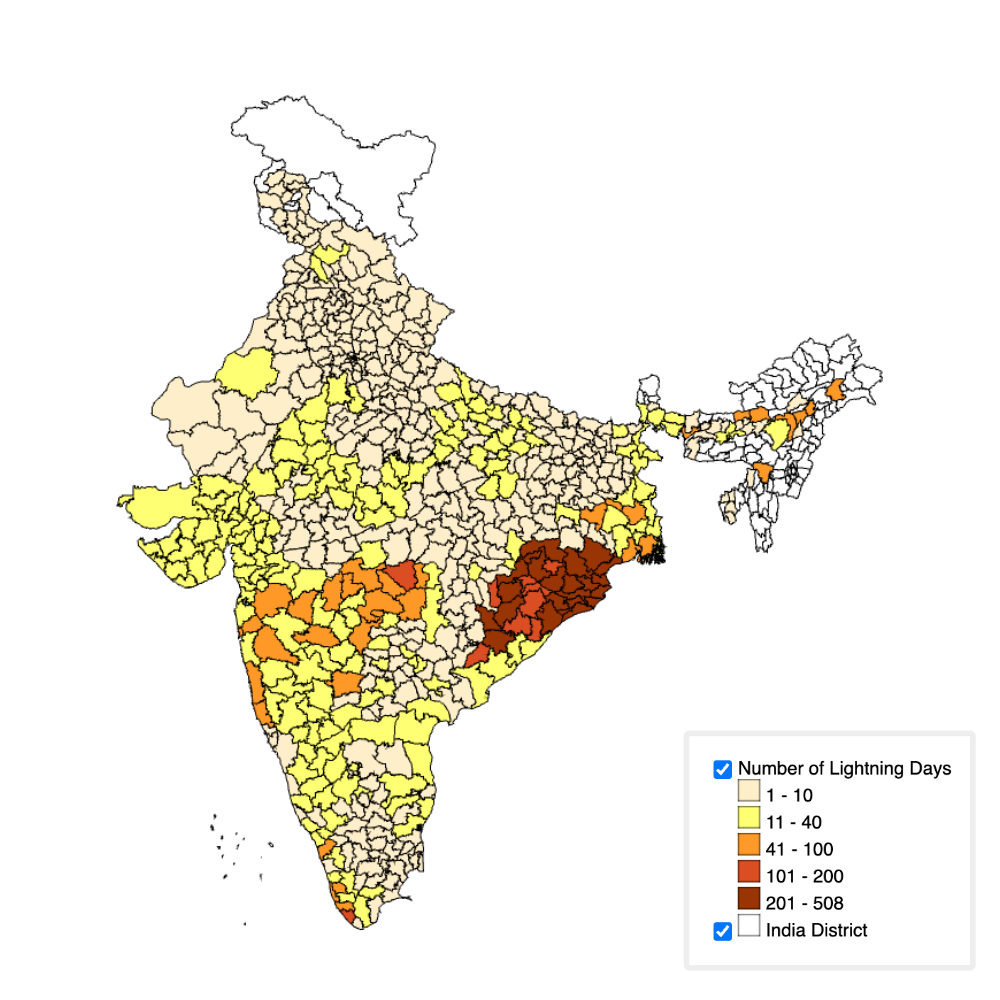
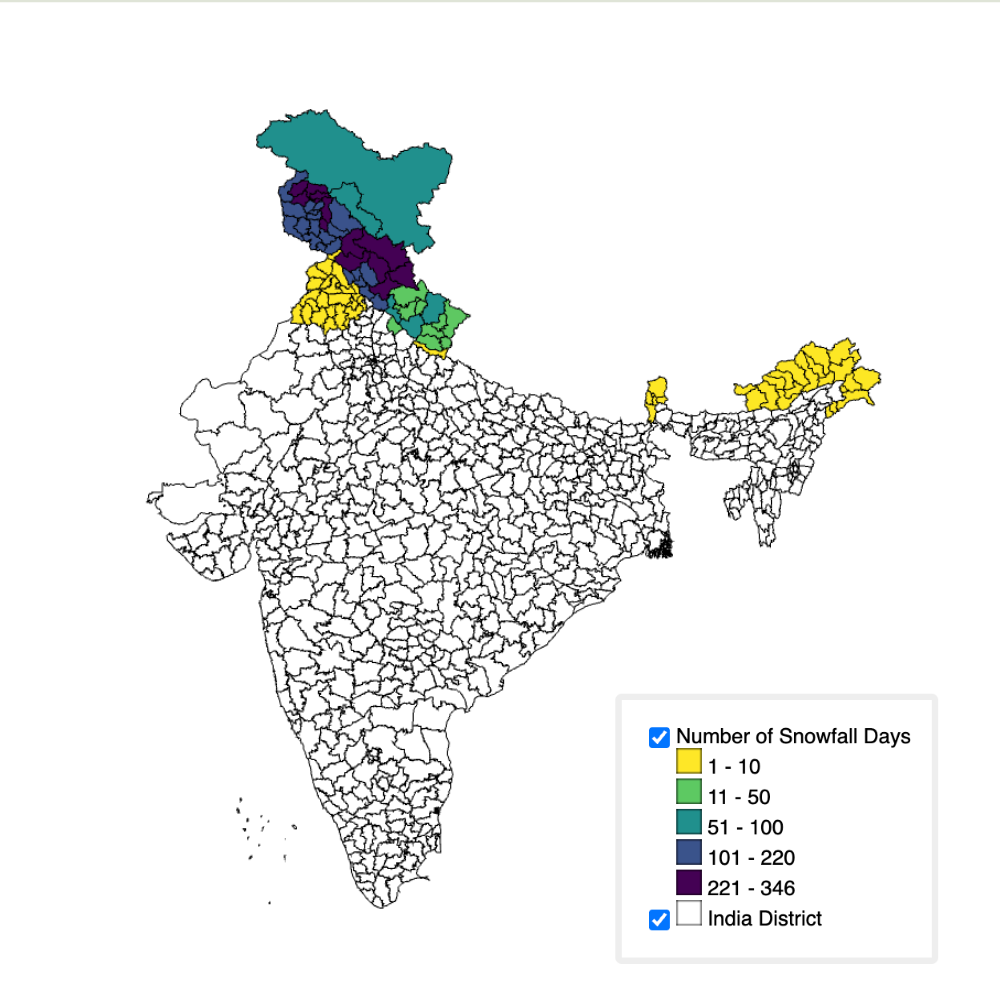
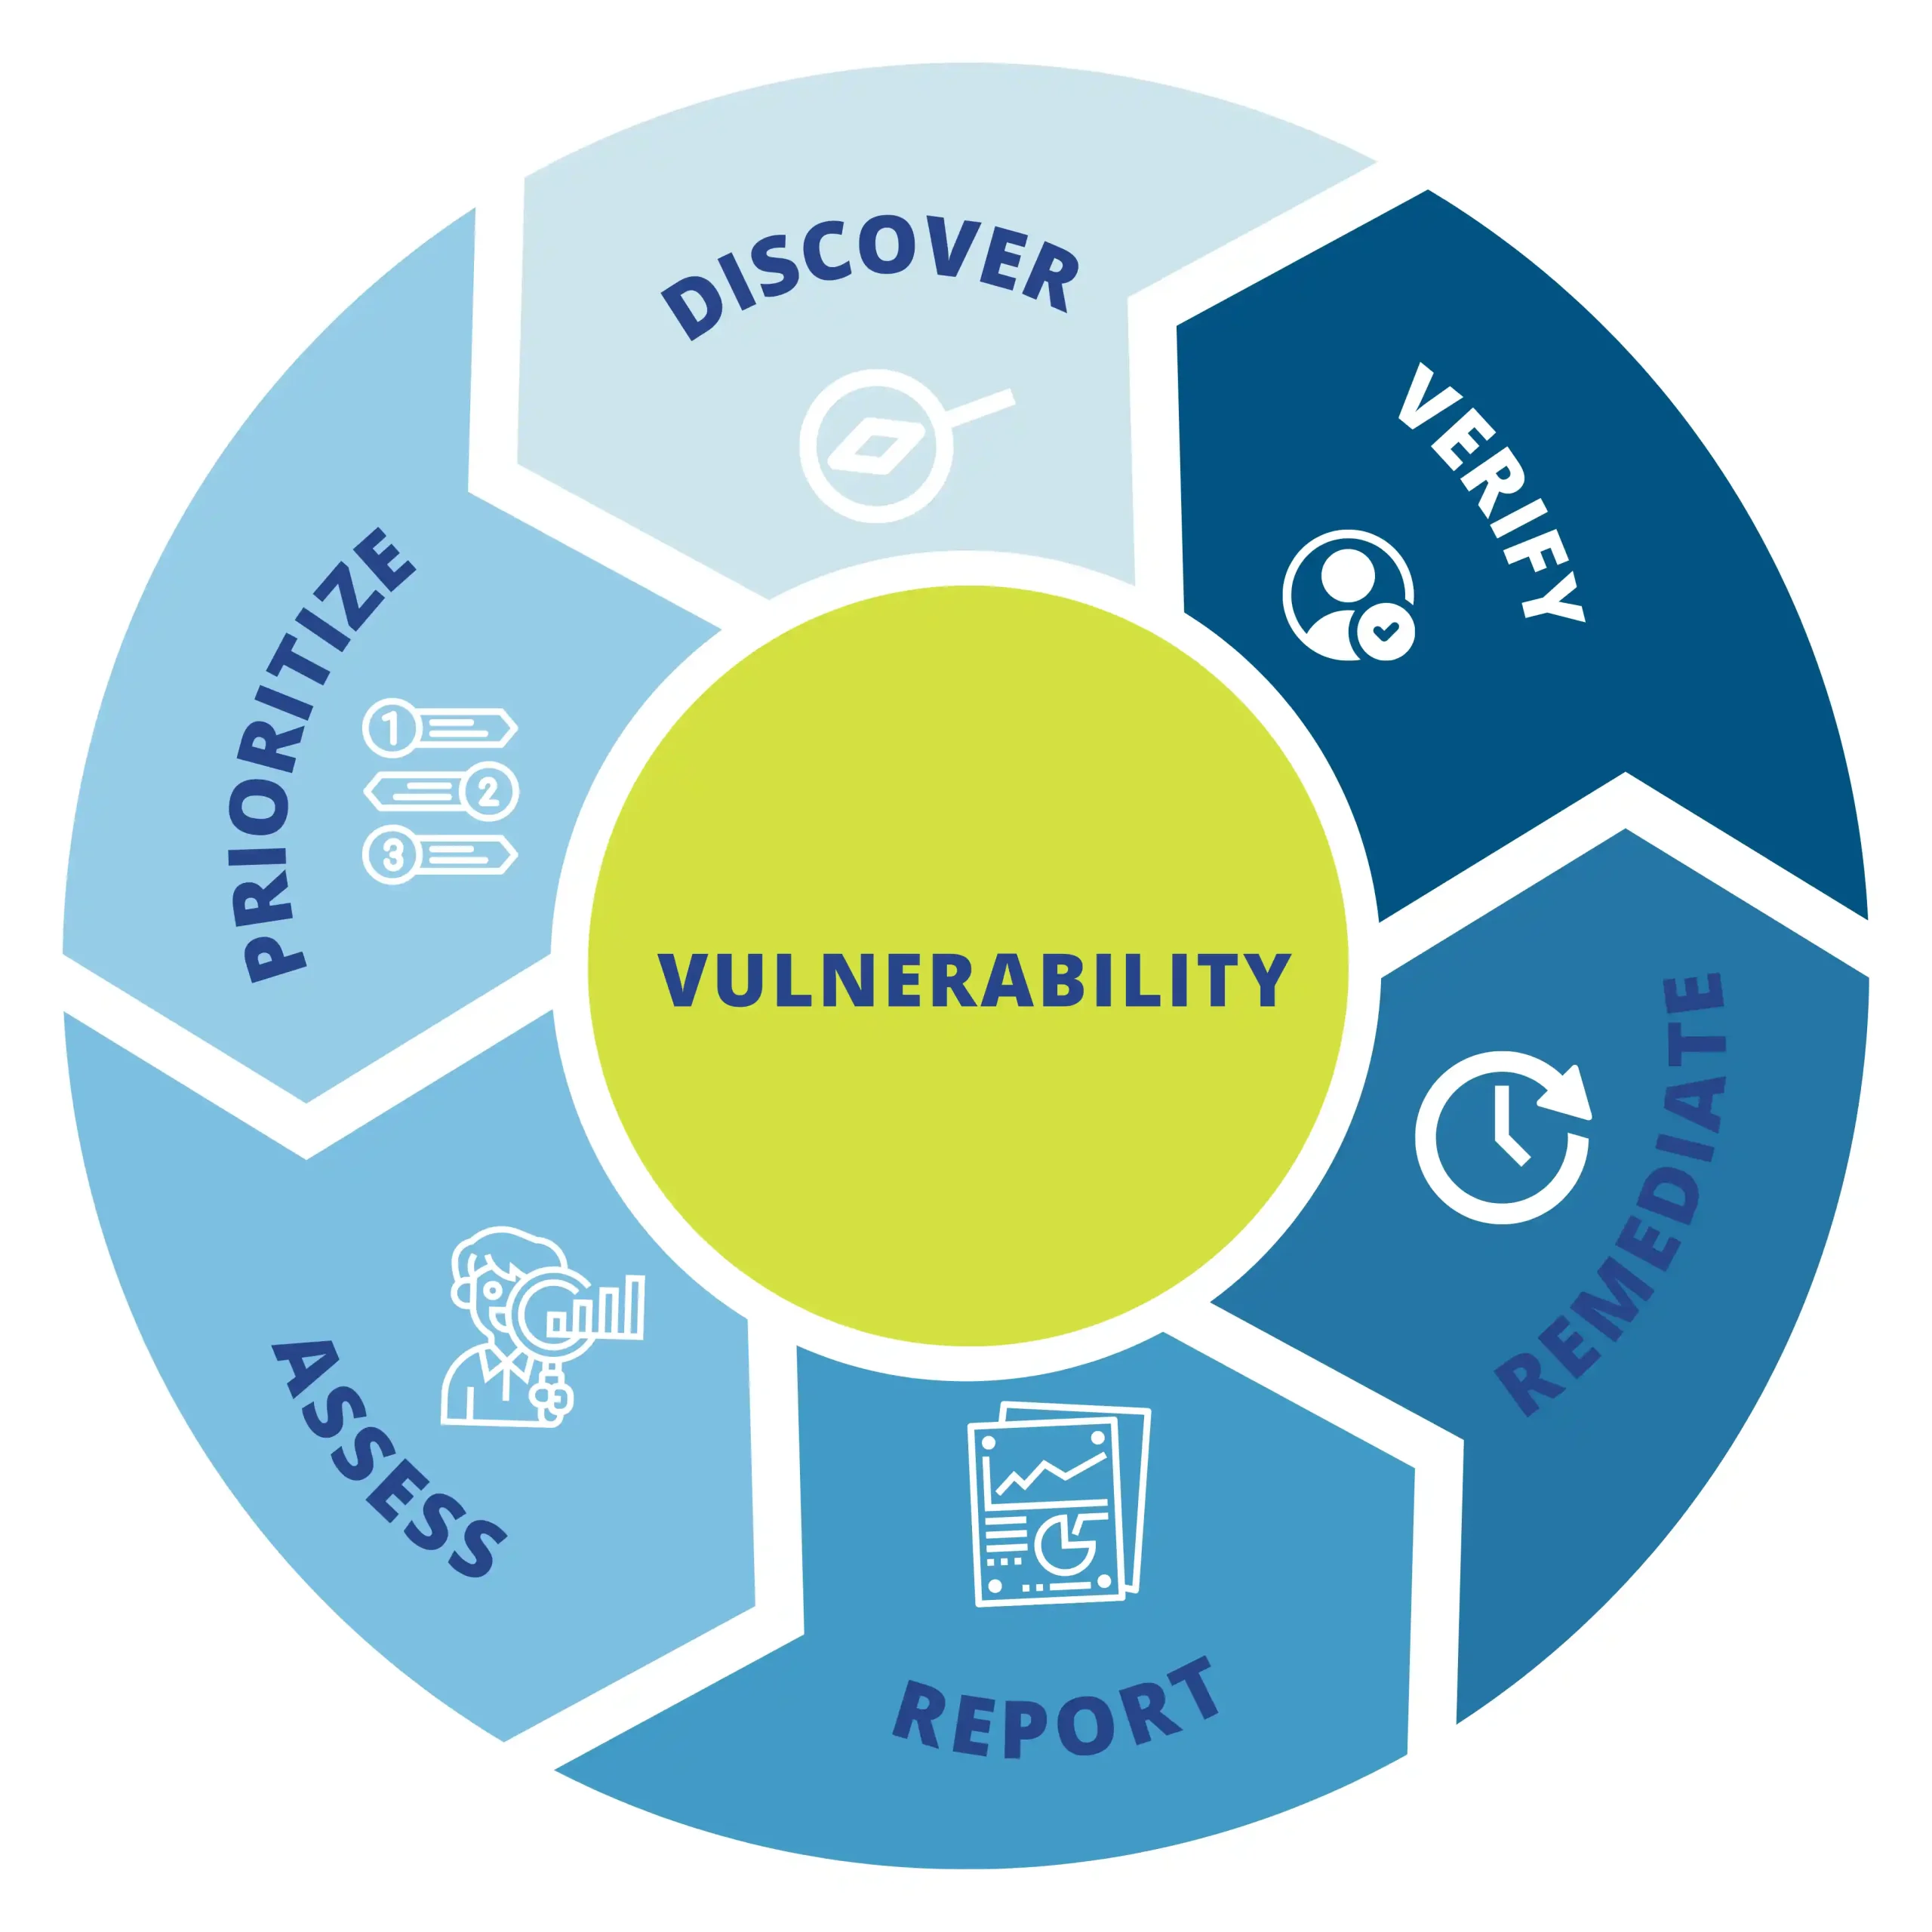
Discover how your country, state, and district are impacted by climate risks. The Vulnerability Index evaluates exposure to extreme climate events and long-term climate shifts over the next 30 years—helping you make informed, location-specific climate action decisions.
- Area-specific climate vulnerability
- Long-term climate risk projections
- Adaptive capacity & resilience insights
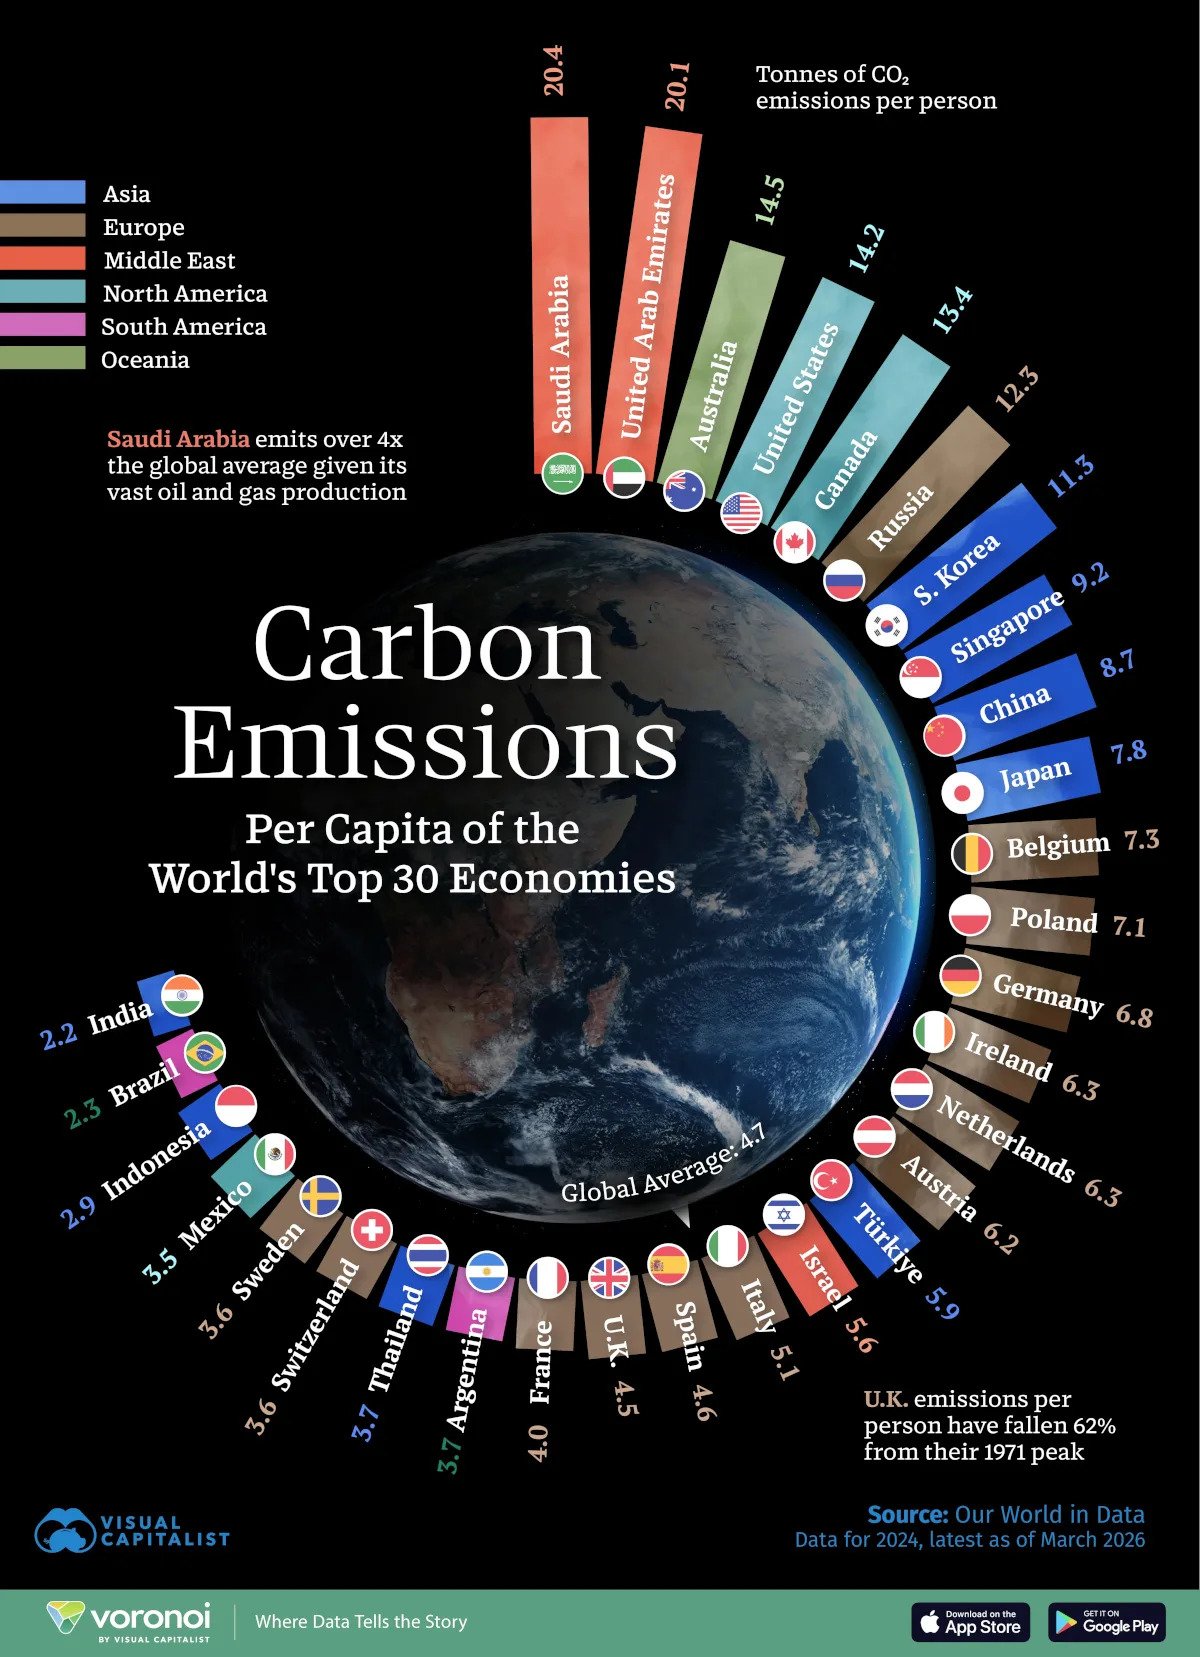
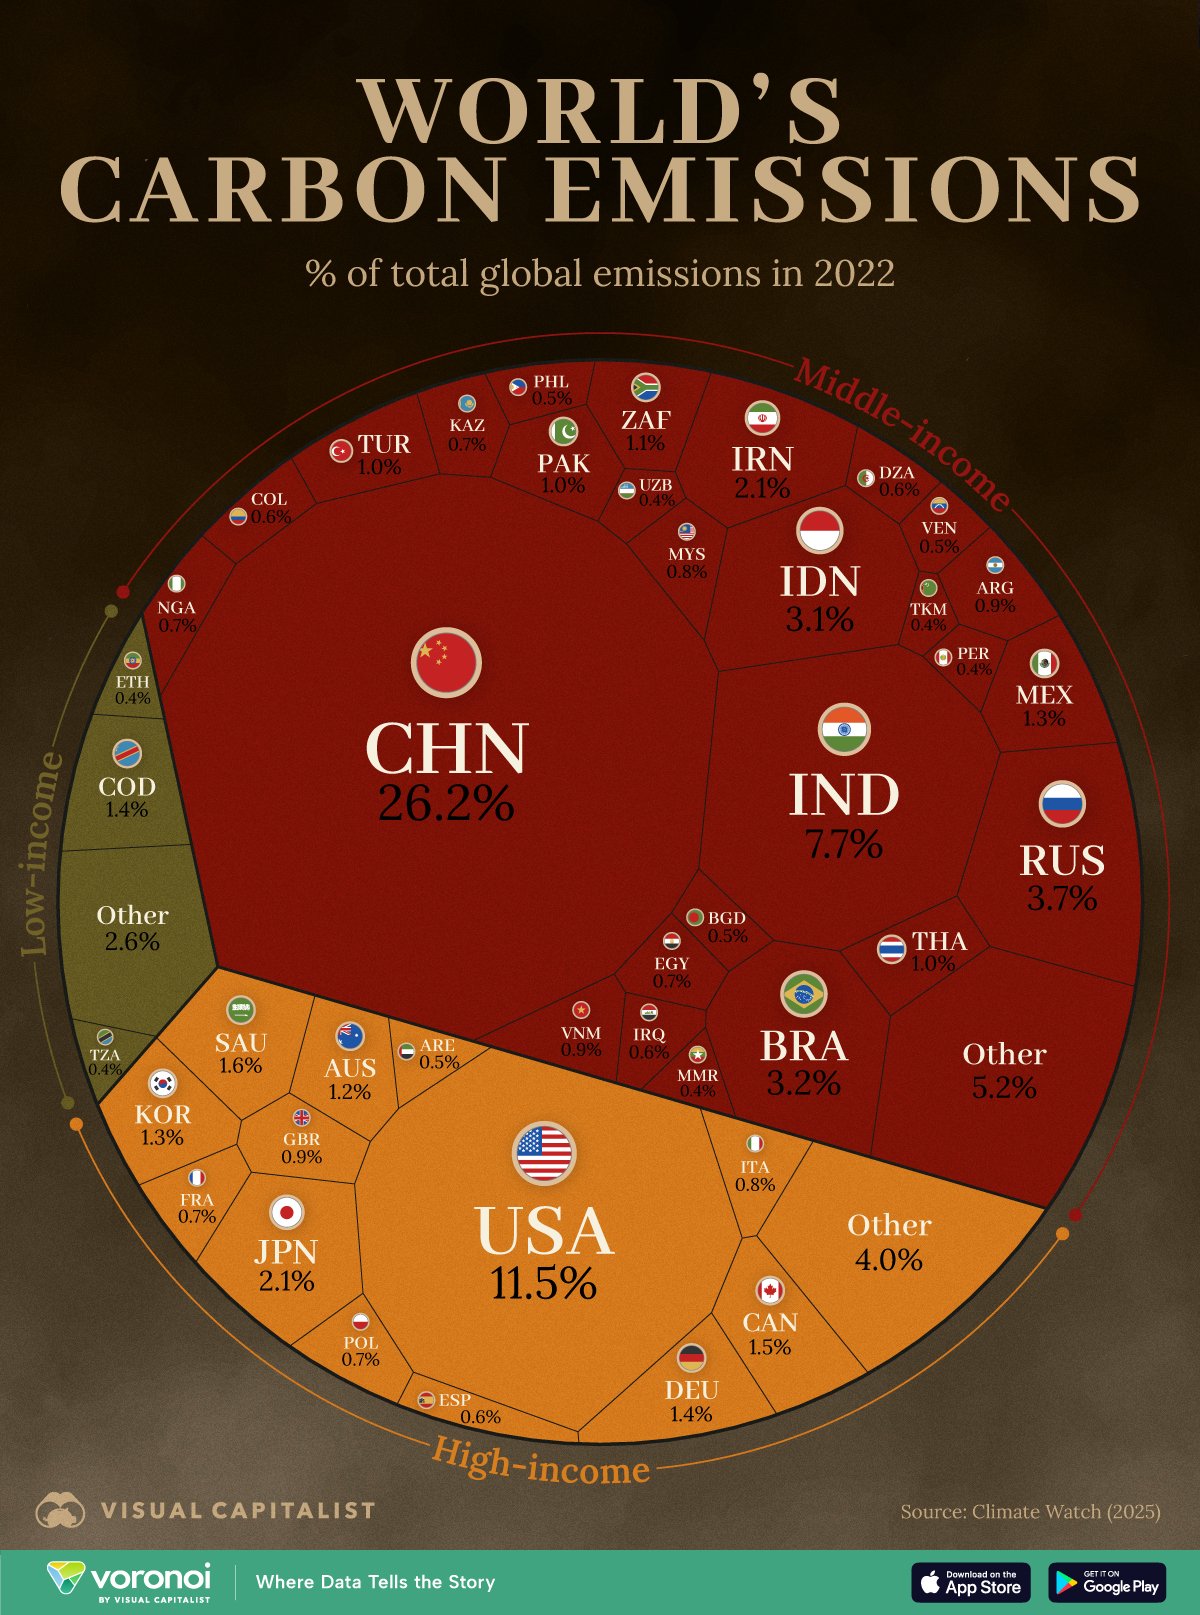
Country-wise Emissions Snapshot